Scafetta comes back for more
Back in March, we outlined how a model-observations comparison paper in GRL by Nicola Scafetta (Scafetta, 2022a) got wrong basically everything that one could get wrong (the uncertainty in the observations, the internal variability in the models, the statistical basis for comparisons – the lot!). Now he’s back with a new paper in a different journal that could be seen as trying to patch the holes in the first one, but while he makes some progress, he now adds some new errors while attempting CPR on his original conclusions.
Observational uncertainty
We pointed out in March that Scafetta had totally neglected observational uncertainty in calculating the observed change in temperature (2011-2021 compared to 1980-1990). Now he has included it, but has made a massive error so that it is roughly a factor of ten too small (though this is progress of a sort!). His error is clear in his Appendix 1, and consists of him using the accuracy of the annual global mean anomaly (around 0.05ºC, cheekily referencing the GISTEMP calculation!) to estimate the uncertainty in the 11-year mean (as 
ºC). Why is this wrong? Well, the observational time-series has a number of different things going on: In any 11 year period, there will be a particular realisation of the weather (from daily to season variability to ENSO effects etc.). This realisation of the ‘noise’ is not however what we are trying to compare the models to (since there is no expectation that would be able to match the specific weather trajectory seen in the real world), we are targetting the long-term change. So in the estimate of that long term change, we need to include the uncertainty of that because of the interannual variability (the ‘noise’ in this case).
In formal terms, we are modeling the estimated decadal change in temperature as a long term climate change, a change associated with stochastic internal variability and measurement error:

with 
assumed to be constant by definition over each decade, and so

The 
can be estimated from the decadal sample and for GISTEMP or ERA5 it’s around 0.05ºC, while  is much smaller (0.016ºC or so). So the 95% confidence interval on the decadal change due to internal variability is therefore around
 ºC – this can’t just be ignored! There is yet another source of uncertainty – that of the forcings themselves. In particular, we don’t have perfect information about how aerosols have varied over the last few decades and uncertainty there translates into differences in temperature trends even if climate sensitivity were perfectly known.
Scafetta also has a bit of a discussion of the uncertainty derived from monthly values instead of the annual numbers, but misses the real issue of the large amount of auto-correlation in the residuals of the monthly SAT time-series (
) which needs to be accounted for when estimating the uncertainty of the mean or trend (since it reduces the effective degrees of freedom). Auto-correlation in the residuals of the annual SAT time-series is small ( ) and can mostly be neglected, and so the standard formulas can be used for the uncertainty.
Pointless distractions
For whatever reason, this new paper is padded with a lot of analyses that add nothing to the conclusions (IMO). This isn’t really very important – many papers suffer from this (maybe even some of mine!) – but it gets in the way of seeing what’s really going on. For instance, note the lack of substantive difference between SSPs in Figure 4 for the period 1980 to 2021 – what was the point in doing the same thing for each scenario when nothing depends on it? (Note that the short period 2015-2021 is not long enough to have the differences in emissions make a big dent in the concentrations or, subsequently, the climate).
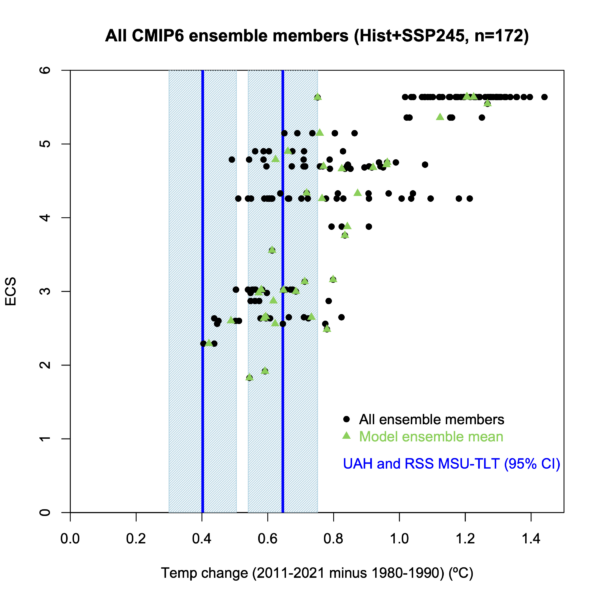
Second, Scafetta takes up a lot of time playing games inspired by the MSU-TLT data – not both versions, that exist from both UAH and RSS, but just the one from UAH which he suggests is (on the basis of nothing) more accurate than any in-situ surface data. My opinion on that probably differs somewhat from his, but the issue is again one of neglected uncertainty. The RSS TLT record warms by 0.65ºC (more than any product in the paper!), compared to just 0.40ºC in the UAH record, and this is not even mentioned, even though on it’s own would make just as clear an argument for an underestimate of climate model sensitivity. The neglect of the very real structural uncertainty in the MSU-TLT records is a(nother) blatant thumb on the scale in support of his preferred conclusion. As you can see here, the inclusion of the RSS data would further undermine Scafetta’s argument:
Third, and this is a minor point (though telling), the spatial map of the GISTEMP results (fig. 7c) and associated text is just wrong. Indeed, all the statements related to the sparseness of the GISTEMP product are wrong. The GISTEMP product is also infilled at the poles (using stations within 1200km), and does not have the gaps shown. I think he has used data from a plotting option with the radius of influence reduced to 250km, but this is not the actual GISTEMP product. This affects (at least) what is reported as the GISTEMP global mean data in Table 4 and probably the rest, but I didn’t check every number.
Triage Mirage
Scafetta’s approach, in both the last paper and this one, is to split the models into low, middle, and high climate sensitivity groups. The IPCC ‘best guess’ for ECS is around 3ºC (with a likely range of 2.5 to 4ºC) from various observational constraints, so someone looking to assess IPCC’s assessment would have made the three groups correspond to ECS < 2.5ºC, ECS between 2.5ºC and 4ºC, and ECS > 4ºC. We suggested this screening in our recent Nature commentary (Hausfather et al, 2022. Scafetta however chooses to split the groups at 3ºC and 4.5ºC, with the groups having a mean ECS of 2.5, 3.7 and 5.1ºC respectively, compared to 2.2, 3.2, and 4.9ºC for an ‘IPCC-like’ grouping, in particular pushing the middle group up near to the edge of the IPCC ‘likely’ values. (Note that group means depend on model selection, and I’m using the 58 models we used in Hausfather et al (2022), compared to Scafetta’s 38. Note also, that the KACE-1-0-G ECS value is wrong: it should be 4.75ºC instead of 4.48ºC and the model should be in the ‘high ECS’ group. This was something we found in writing our commentary and is in the supplemental data there, but obviously hasn’t propagated fully through the data ecosystem). The point is to bolster unsupported claims such as “only the low ECS GCM group can be considered sufficiently validated” which can then be recycled in the contrarian media-sphere.
But even so, it’s clear from Fig. 4 (as it was in our figure in the initial complaint) that the in situ and reanalysis observations are consistent with having been drawn from many of the model ensembles in Scafetta’s medium and even high ECS groups.
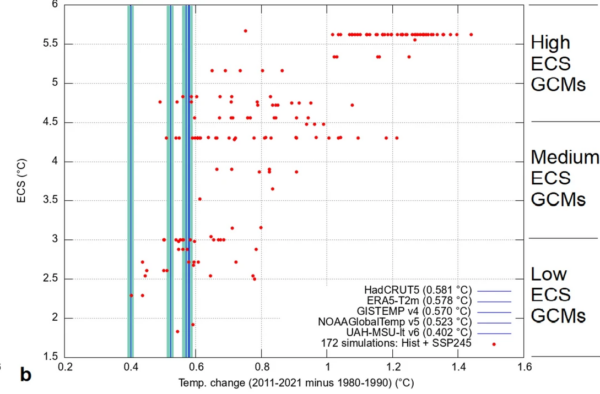
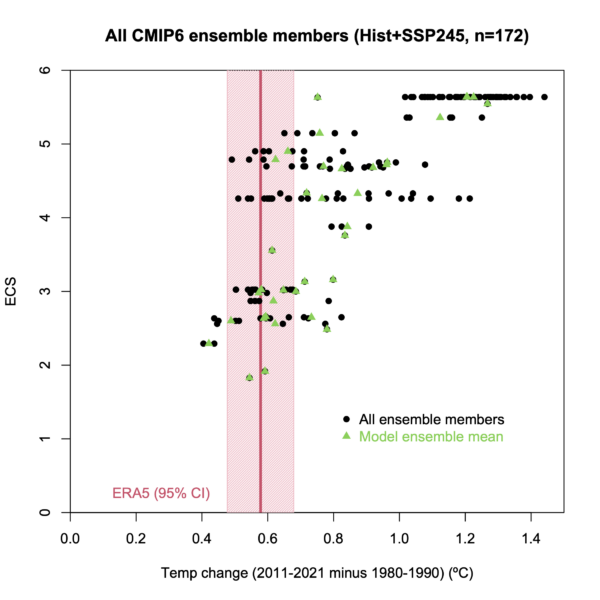
Specifically, while on average, there is a tendency to higher temperature changes in higher ECS models (as would be expected), the observations (with the exception of UAH-TLT) are clearly compatible with many of the models with ECS>3ºC (though not for ECS>5ºC – the conclusion reached by the IPCC!). Given that the real world is just one realization of a chaotic system, you should not reject a model if the real world falls within the expected ensemble spread. In our note from March, we gave a specific statistical test that specifically addresses this situation (taken from a similar case discussed in Santer et al (2008)) – unsurprisingly, Scafetta ignores this, since the ERA5 observations are compatible with over 65% of the models for which there are multiple ensemble members.
Even real issues are botched
To be clear, there are real issues with the CMIP6 ensemble. Some of the high ECS models (ECS > 5ºC) are incompatible with recent trends and it does make sense to screen them out (or down-weight them) in near-term transient predictions (Hausfather et al, 2022). There are systematic differences in the Southern Ocean in recent decades between the observed and modeled SST trends. However, the real issues that these mismatches engender are not even mentioned, let alone discussed: Are there issues with the forcings that are artificially boosting warming in some models? Yes. (Fasullo et al, 2021); Are there processes missing in all these CMIP6 models that can explain the southern ocean discrepancy? Probably. (Rye et al, 2020); Is cloud phase in some models being inappropriately tuned? Maybe (Cesana et al, subm). Instead we get a litany of vague insinuations about supposedly ignored urban heat island effects (citing the same three papers multiple times) with a dash of astrology. I mean, really, who reviewed this? (And don’t get me started on the information-free extrapolation of his results to climate policy!).
Bottom line
As was clear in the comment we made on his first paper, the internal variability of the multi-model ensemble and the observational uncertainty in the trend, make Scafetta’s preferred conclusion (that we should reject all models with ECS above 3ºC), untenable. Rather than some new ‘advanced’ methodology that better constrains ECS than any previous work, the efforts here are shoddy, derivative, and, when examined, actually support the previous conclusions from the IPCC and the papers they relied on. These two papers should become object lessons in how not to compare models with observations which, ironically, might make them relatively well cited.
References
- N. Scafetta, “Advanced Testing of Low, Medium, and High ECS CMIP6 GCM Simulations Versus ERA5‐T2m”, Geophysical Research Letters, vol. 49, 2022. http://dx.doi.org/10.1029/2022GL097716
- Z. Hausfather, K. Marvel, G.A. Schmidt, J.W. Nielsen-Gammon, and M. Zelinka, “Climate simulations: recognize the ‘hot model’ problem”, Nature, vol. 605, pp. 26-29, 2022. http://dx.doi.org/10.1038/d41586-022-01192-2
- J.T. Fasullo, J. Lamarque, C. Hannay, N. Rosenbloom, S. Tilmes, P. DeRepentigny, A. Jahn, and C. Deser, “Spurious Late Historical‐Era Warming in CESM2 Driven by Prescribed Biomass Burning Emissions”, Geophysical Research Letters, vol. 49, 2022. http://dx.doi.org/10.1029/2021GL097420
- C.D. Rye, J. Marshall, M. Kelley, G. Russell, L.S. Nazarenko, Y. Kostov, G.A. Schmidt, and J. Hansen, “Antarctic Glacial Melt as a Driver of Recent Southern Ocean Climate Trends”, Geophysical Research Letters, vol. 47, 2020. http://dx.doi.org/10.1029/2019GL086892